Benchmarking Student Data Is Key to Understanding Proficiency
By Tim Essenburg
On August 25, the Minnesota Department of Education released the 2021-2022 Minnesota Comprehensive Assessment (MCA) data. A week later the National Assessment of Educational Progress released reading and math scores for 9-year-old students across the country (NAEP-9).
These scores provide the best snapshot of how students are doing since before the pandemic, and in both cases, proficiency fell significantly relative to 2019 and early 2020. No doubt the full force of all that the COVID pandemic wrought—including distance learning, mental health challenges, household financial stressors, and teacher burnout—is reflected in these scores. Let’s take a look.
Where We Are in Minnesota
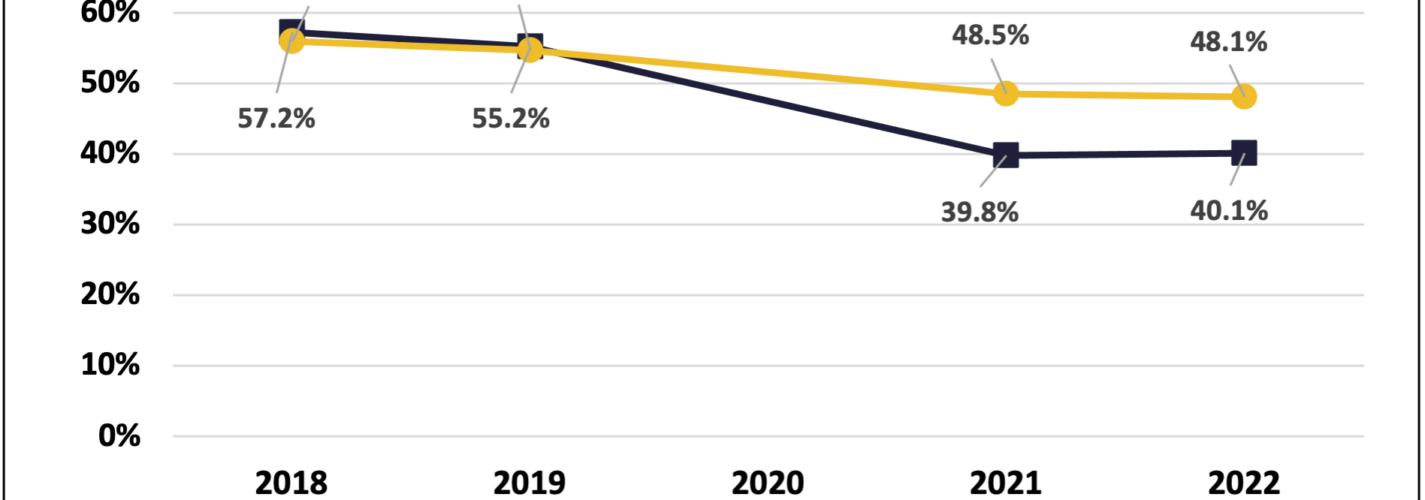
We took a look at 3rd grade reading and 8th grade math proficiency in Minnesota, from 2018 through 2022, to understand trajectories through the pandemic. This year’s data is the most accurate we’ve had for the past several years: in 2020, annual tests were cancelled, and in 2021, many students did not take the test for logistical, health, and other reasons, making 2021 data not strictly comparable to the other years’ data.
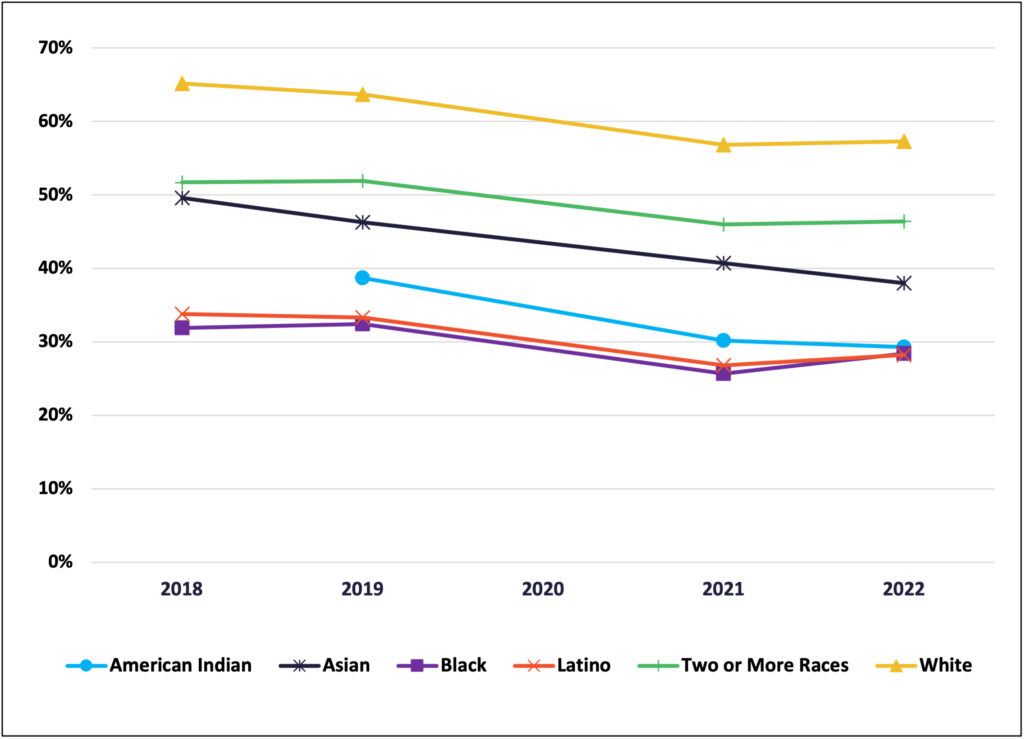
There are two main takeaways for both math and reading: 1) proficiency rates fell considerably from 2019 to 2022 and 2) gaps persisted across lines of race and ethnicity, income, and special education and English Learner status. Across the board, for every student group, 8th grade math proficiency fell below 50% this year—while Black and American Indian student groups fell below 20% proficient. While reading proficiency declines were not as pronounced, they were still significant. Statewide, less than half of Minnesota third-graders demonstrated 3rd grade reading proficiency this year.
Average MCA Proficiency, 3rd Grade Reading & 8th Grade Math, 2018-2022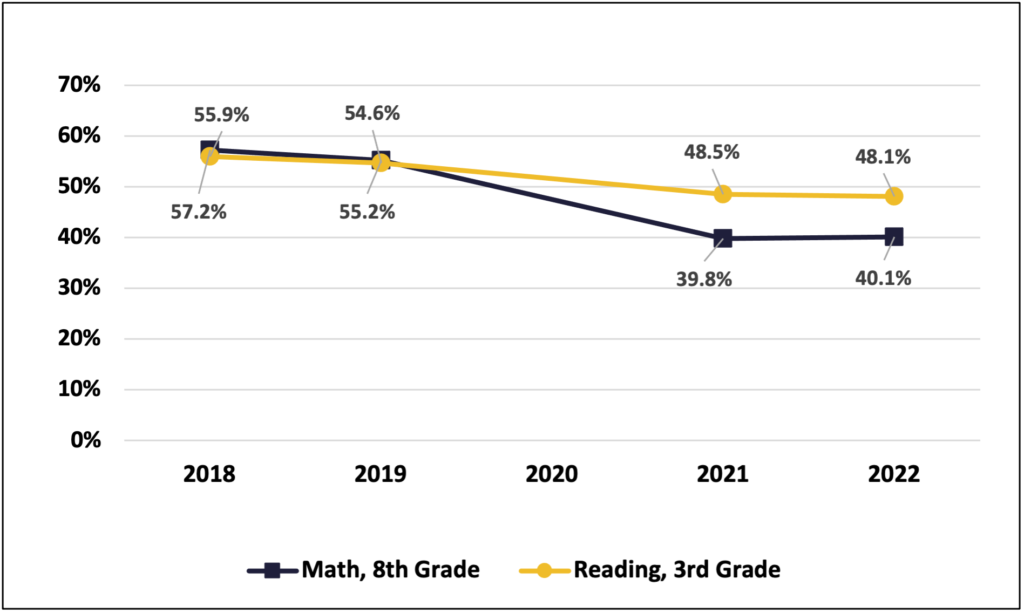 MCA Proficiency by Race/Ethnicity, 8th Grade Math, 2018-2022
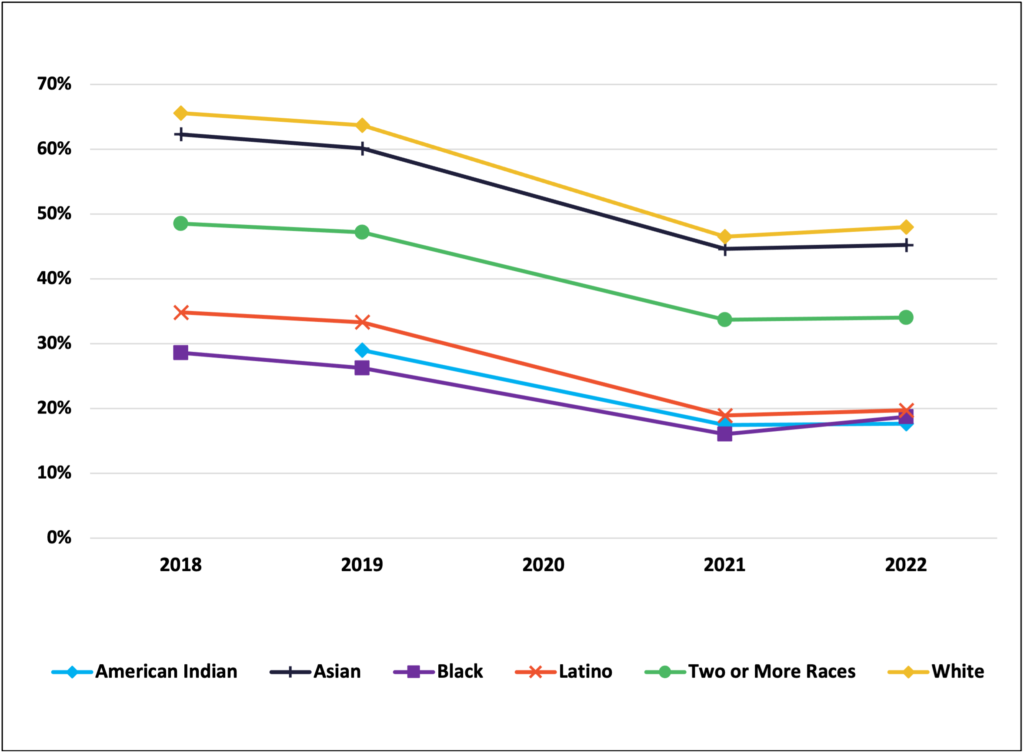
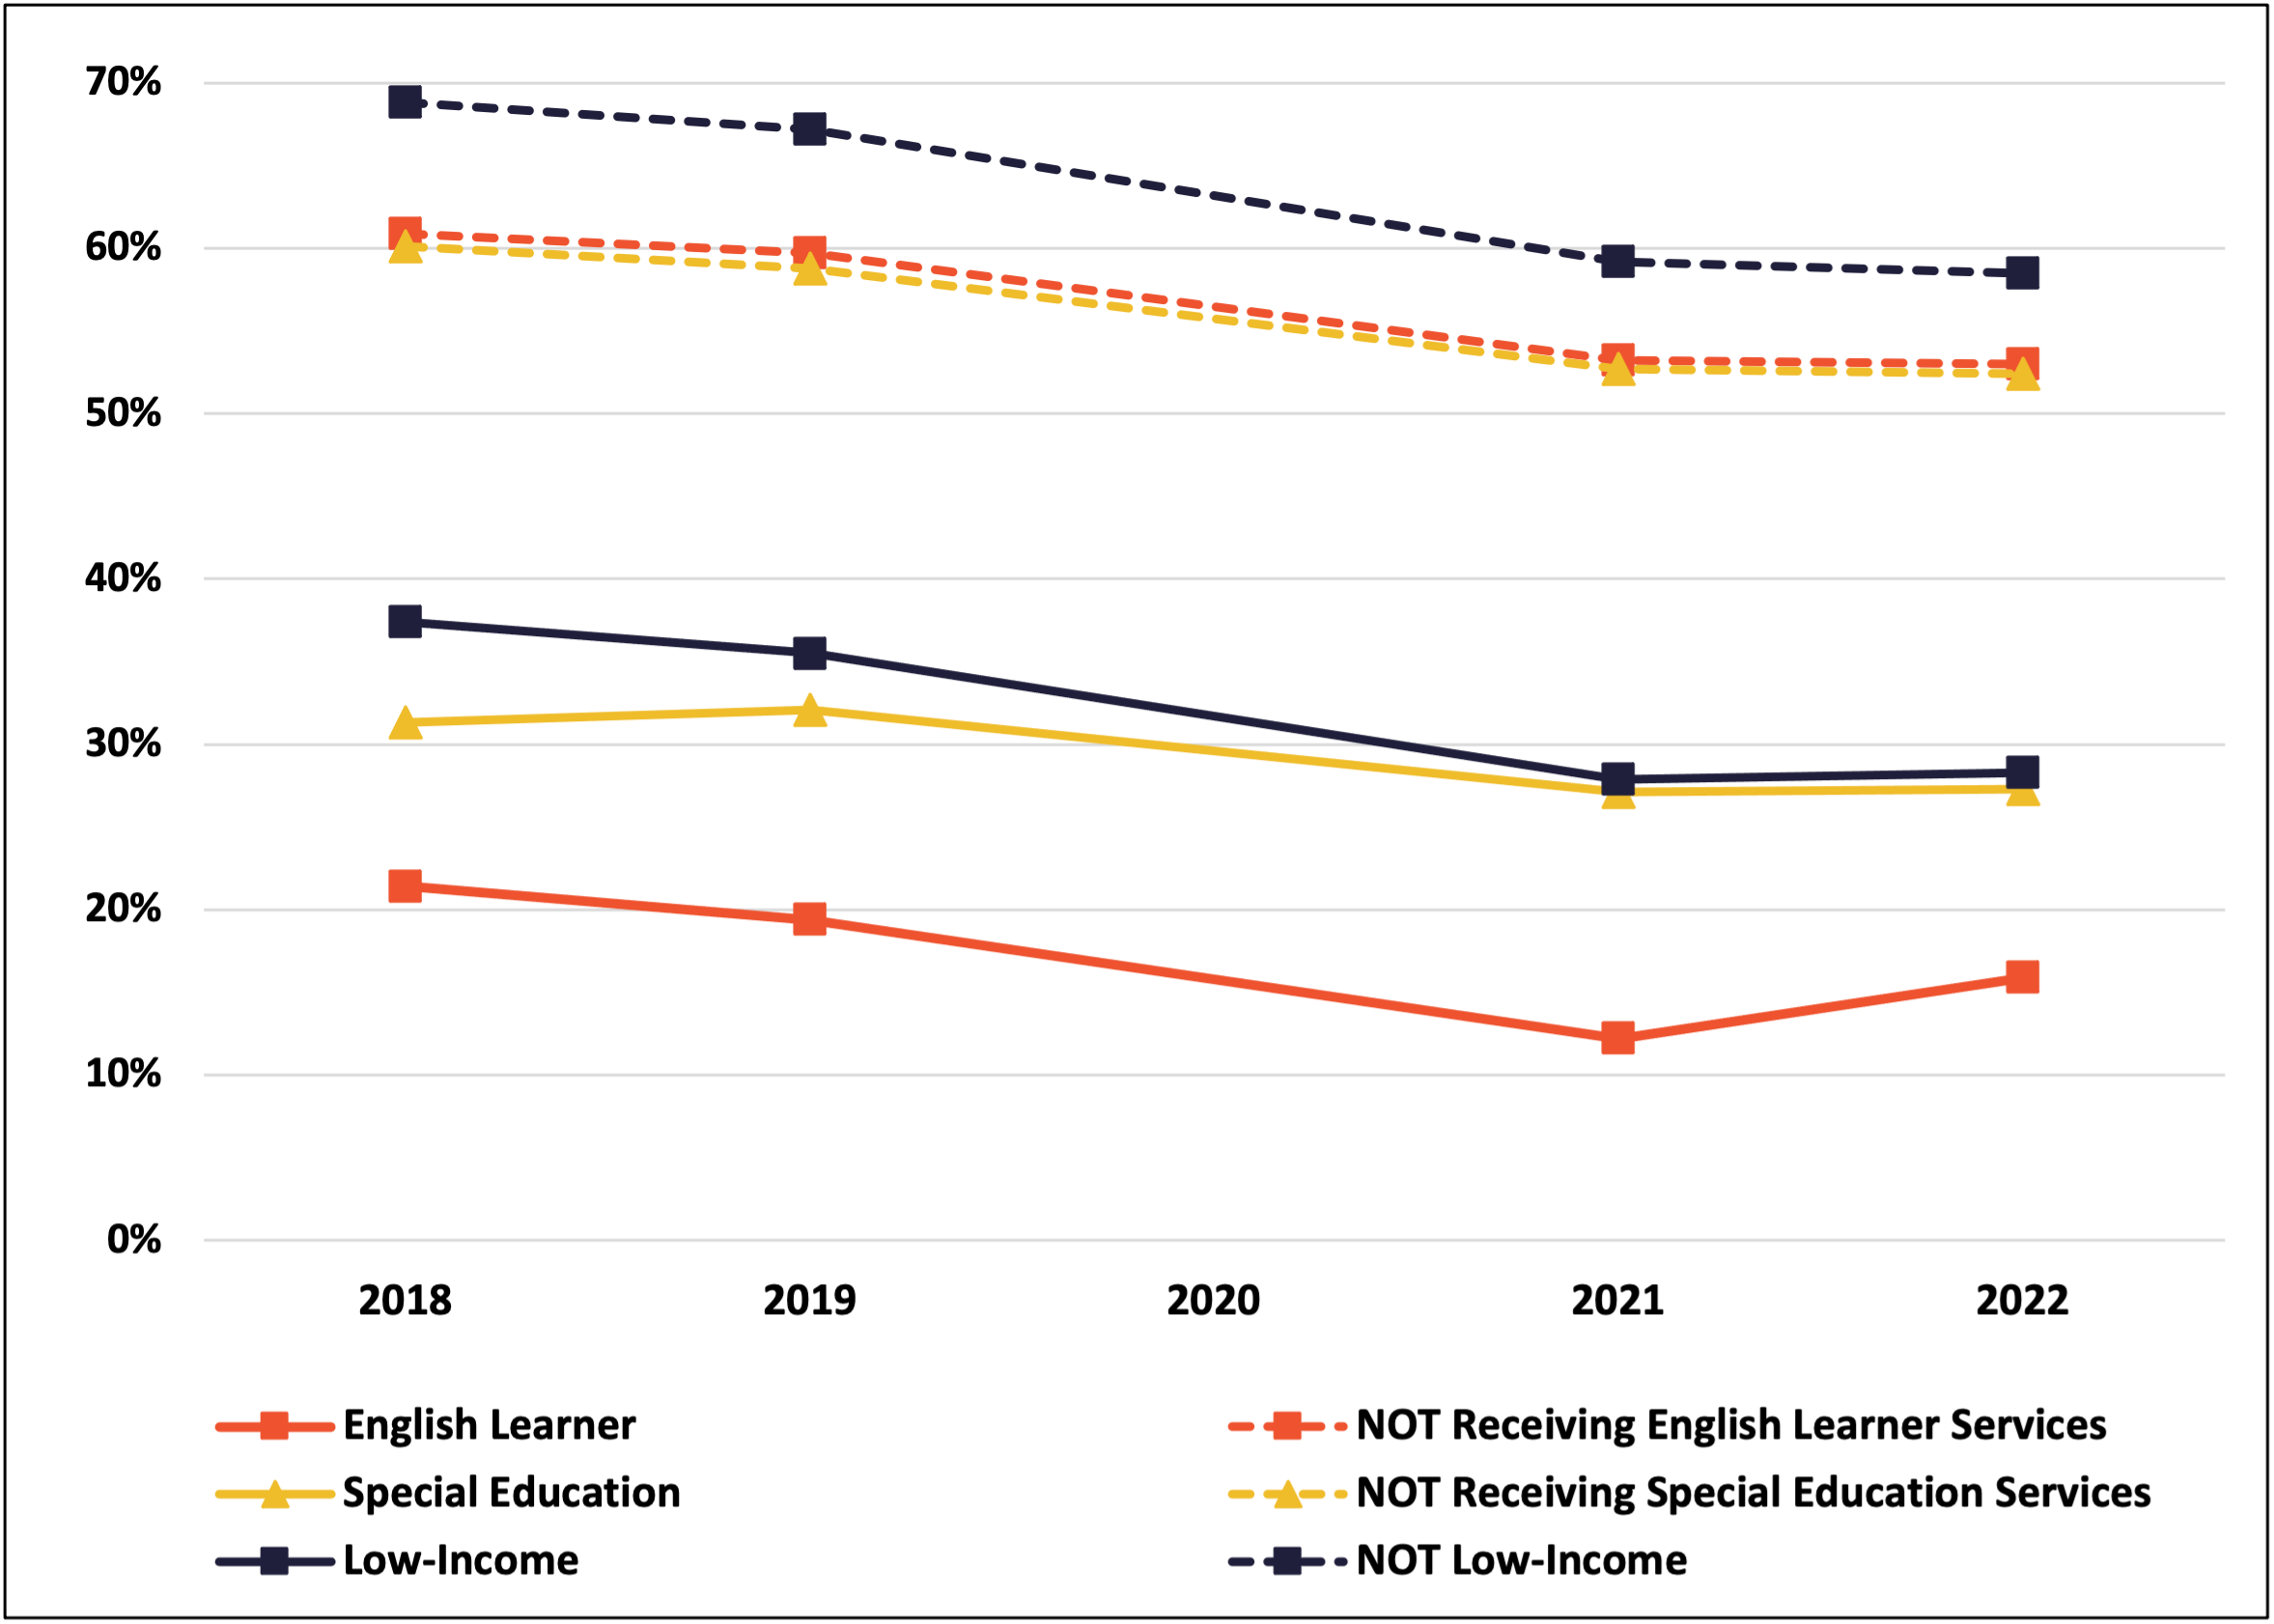
MCA Proficiency by Income, Special Education, and English Learner Status, 8th Grade Math, 2018-2022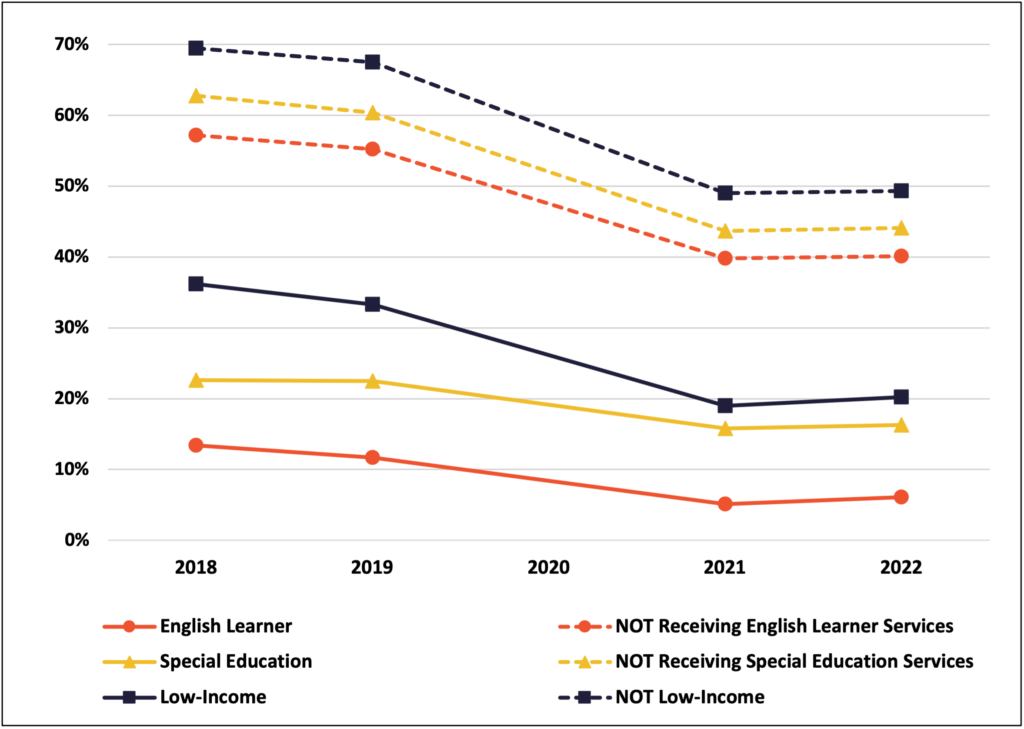 MCA Proficiency by Race/Ethnicity, 3rd Grade Reading, 2018-2022
 MCA Proficiency by Income, Special Education, and English Learner Status, 3rd Grade Reading, 2018-2022
Source: Minnesota Department of Education, Minnesota Report Card, https://rc.education.mn.gov/
One important factor to consider is the percentage of students that took the math and reading tests. Across the board, far fewer students took the MCAs in 2021 than in 2019—when 97% participated in the math assessment and 99% in reading. In 2021, the number who took the 8th grade math assessment fell by almost 25 percentage points to 73% and for 3rd grade reading the percent tested fell by about 14 percentage points, to 85%. The drop in testing was most significant for students of color and Indigenous students, low-income students, students with disabilities, and English Learners. These gaps could reflect access due to COVID-protocols, in addition to contextual choices around test administration and families’ own decisions. In 2022, test participation went back up significantly, with gaps between student groups all under three percentage points.
Minnesota Results Mirror National NAEP-9 Trends
Every two years, a representative sample of 4th and 8th grade students across the country take a NAEP test that allows for apples-to-apples comparison across states. This data will be available later in the fall. NAEP also tests by age group and released new data for 9-year-olds—allowing for comparison to previous results from 2012 and 2020.
The data follow a similar pattern to what we found in MCA data. Average math and reading scores fell significantly, and this held true across race/ethnicity, English Learner, and Free/Reduced-Price Meals (Special Education data were only reported for 2022). In addition to this pattern of decline, the gaps between various student groups also reflected those of the MCAs.
Average NAEP-9 Scores, Math and Reading, 2004-2022
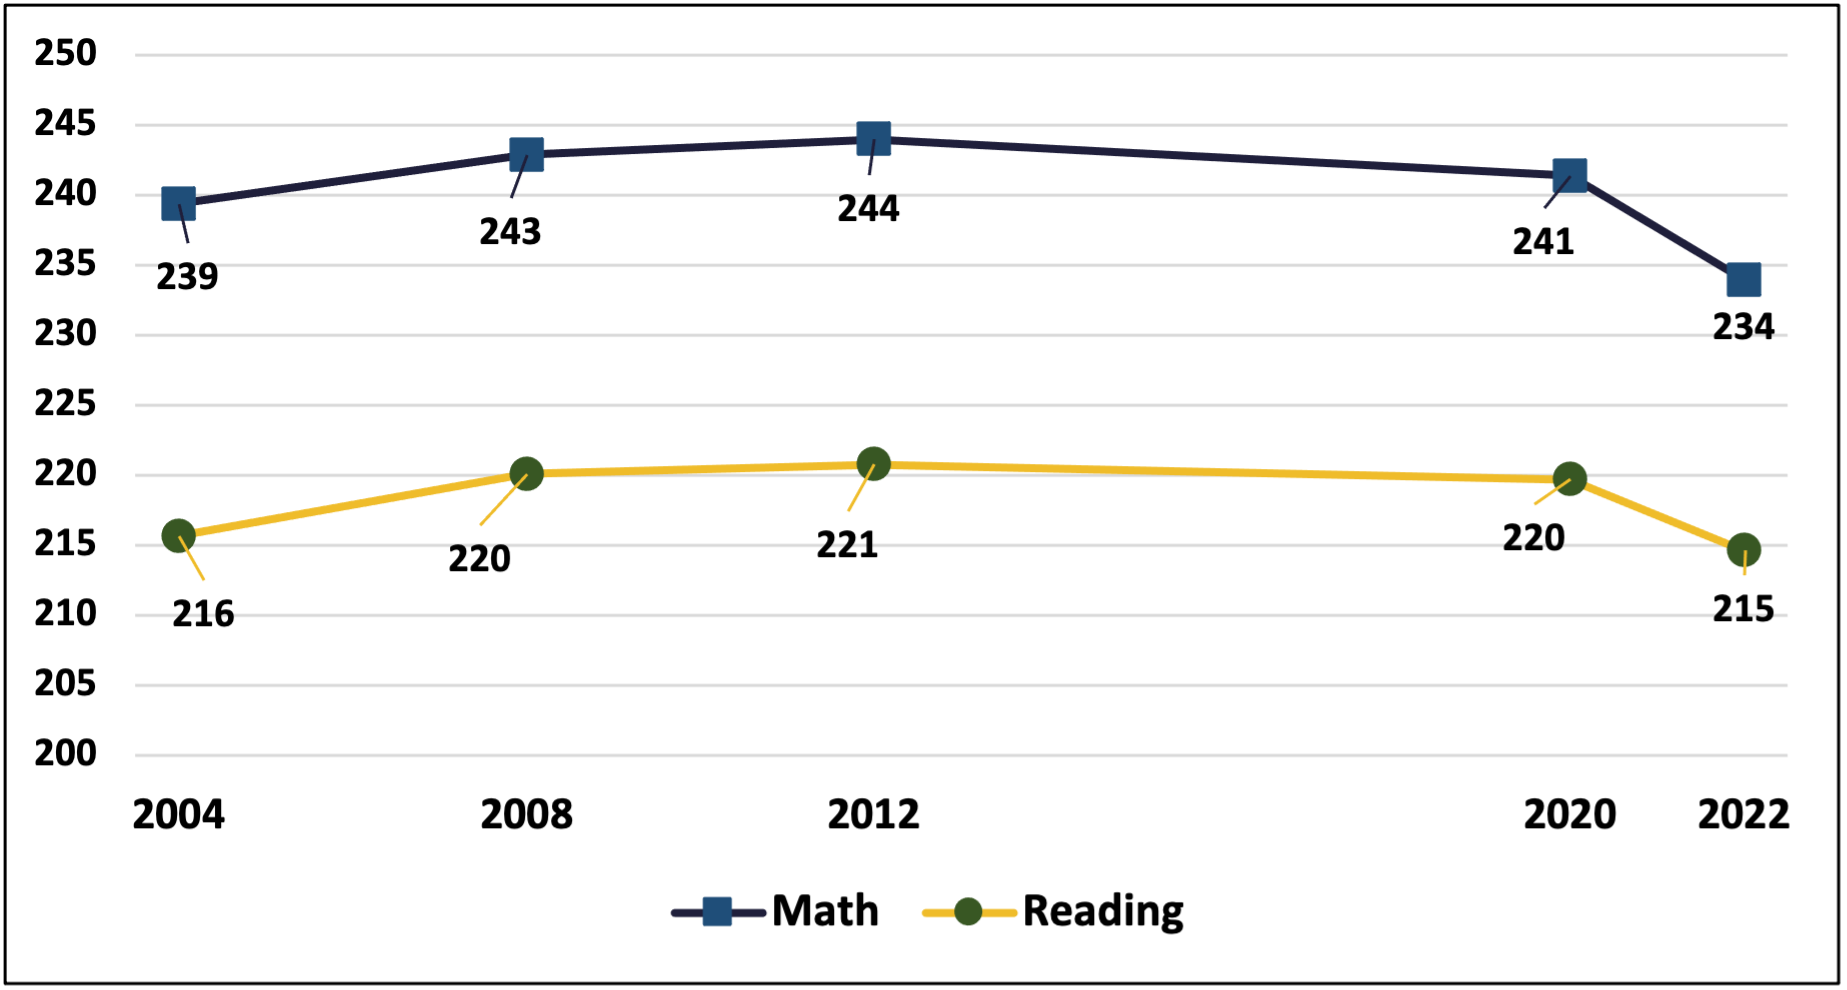
Source: https://www.nationsreportcard.gov/ndecore/xplore/ltt
The grade-level NAEP data due out this fall will allow for interstate comparisons and offer an additional perspective. We’ll be able to better estimate how Minnesota students fared relative to students in other states. Importantly, this data supplements but does not replace data gathered through the MCAs. While the NAEP gives a national picture, only the MCA provides enough detail to explore what’s happening across local districts, individual schools, and specific demographic groups. Moreover, the MCAs are the only test designed specifically to measure state-adopted academic standards. As those evolve, so does the MCA.
Going Forward
As the pandemic wanes and school routines move closer to what is typically expected, we will likely see scores tick upwards. However, getting students back on track and closing gaps may necessitate additional and ongoing educational interventions. as well as a recommitment to ensuring strong core instruction—for example, curriculum based on the science of reading and intensive tutoring designed around student and family needs.
What is clear is that we will need to keep measuring student learning and progress relative to the benchmarks emerging through 2022 data. We have a long way to go, and families, communities, educators, and advocates alike deserve a clear sense of where the current generation stands and what they still need—including on math, reading, and post-secondary outcomes, all disaggregated by race, income, English learner status, disability, and region.